How to Visualize Your Cloud Deployments - Hava

This is the third in a series of posts highlighting tools I have found particularly useful for visualizing AWS and Azure, including:

In this post we will take a look at Hava - https://www.hava.io/

Hava

Hava is a web based service that produces automated diagrams of your existing infrastructure and network topology in both AWS and Azure. Diagrams are created by connecting to your AWS and Azure accounts via a read only user account, that securely gathers all items in a VPC or Resource group. Connections, security groups, cost estimates are all things that Hava diagrams provide. Below is a simple diagram of an AWS deployment.

prod_diagram.png

Azure Support

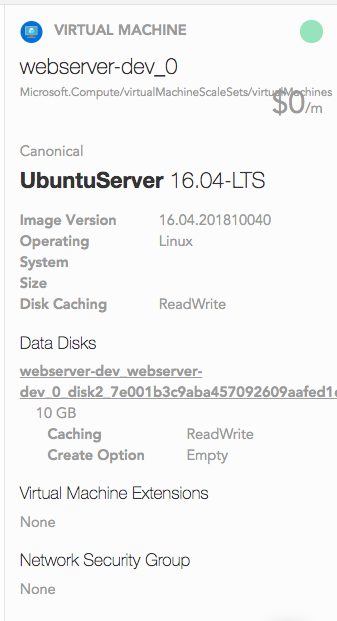
Unlike other visualization tools, Hava supports both AWS and Azure deployments. Resources of a given Azure resource group are diagramed and their details are provided. Azure diagraming supports versions which allow you to look a differences within a given resource group over time. Below is a diagram of an Azure deployment.

HavaIOAzure.png
havaversions.png
havadetails.png

Benefits:

  • Of the three visualization tools compared in this series, Hava is the only one that supports both AWS and Azure. I really like the flexibility to diagram both, as it helps show case multi-cloud deployments.

  • Hava provides not only infrastructure diagrams but also includes a security view for it’s Professional users. This is helpful to visualize security group interactions.

  • Excellent support. As I have been using Hava, I have run into a few snags with the live updates. I was very pleased with the level of support provided to correct the issues. In fact the website provides a chat window so talk directly with support to get questions/issues answered. Kudos to the Hava team, and in particular Adam for his help.

havasupport.png

Nice to Haves:

  • I have found the pricing of Hava to be out of many’s price range. To get the infrastructure and security views, which I believe is one of Hava’s biggest benefits, the cost is $99/month. This is double the price of the other offerings. If you strip out the security components they do have a $49/month offer which is reasonable for being able to diagram both AWS and Azure deployments.

  • Azure support is there, but currently feels like a second class citizen. AWS resources and diagrams are more robust and security views are not yet available for Azure.

Below is a cost model for the different Hava subscription levels.

Havacosts.png

How to Visualize Your Cloud deployments - Cloudcraft

This is the second in a ‘series’ of posts highlighting tools I have found particularly useful for visualizing AWS and Azure, including:

In this post we will take a look at Cloudcraft.

Cloudcraft

Cloudcraft is an online diagraming tool that allows you to both create diagrams through a designer interface and also pull in live inventory from AWS via a secure connection. Cloudcraft is all in on AWS. In fact if you are doing a fair amount of work in AWS there is a good chance you are already familiar with Cloudcraft, but if not it is worth checking out. I liken their designer as a “Visio on Steroids” for AWS. The design below was built using the CloudCraft visual designer to illustrate a web app deployment on AWS.

cloudcraft_designer.png

Within the designer you can perform a search to highlight AWS components including a region, tag, or component name. Below we are highlighting all components in the us-east-1 region. This search could be refined for example to show all EC2 instances within the us-east-1 region tagged for production.

cloudcraft_designer_tags.png

In addition to visualizing the deployment, Cloudcraft also offers a pretty impressive budget feature. This breaks down the anticipated cost and allows you to modify the design by exploring different compute, database, storage and networking sizes broken down by cost. When making changes within the budget view your design is automatically updated to reflect the updates. You can also export your design as a PDG for PNG, as well as share via a link to others on your team.

cloudcraft_budget.png

Once deployed, Cloudcraft offers a ‘Live’ mode as part of the professional subscription which allows you to discover and import your AWS inventory into the designer view. Below is the Cloudcraft visualization of the web application deployment highlighted in several of my Terraform posts.

cloudcraft_live.png

Benefits:

  • Allows you to produce an architecture diagram without any need for deployment. After all, sometimes we just want to diagram things without actually deploying them.

  • The web interface is really spectacular. Cloudcraft in my opinion has the best looking 3D and 2D (with integration to draw.io) diagrams, which I find useful for presentations, papers and web posts.

  • Pricing Breakdown: Cloudcraft is completely free for single users to design and save an unlimited number of private diagrams. This includes designer, cost calculations, design documentation and export. The Live features are included in the Pro version along with team collaboration and support which is currently listed as $49/month. For a complete pricing/feature break down check out CloudCraft’s pricing guide.

Nice to Haves:

  • The auto-layout within the ‘Live’ import can be a little clunky and sometime hard to manage. Based on some reading, Cloudcraft recognizes this and has start to improve their auto-layout algorithms.

  • Support only for AWS, it would nice to be able to see support for other clouds (Azure, GCP, etc.)

How to Visualize Your Cloud deployments - CloudMapper

As you are aware, I am a big fan of visualizations.  In fact one of my most popular set of posts centers on using RVTools to collect and visualize a VMware environment.  As much of my focus is now centered on cloud deployments I wanted to highlight some of the tools I have found particularly useful for visualizing AWS and Azure.  These are:

  1. CloudMapper

  2. CloudCraft

  3. Hava

CloudMapper

CloudMapper is a tool from Duo Security for visualizing Amazon Web Services (AWS) cloud environments.  It was build out of a need to help people perform their jobs easier by providing simple and interactive visualizations of their AWS account.  CloudMapper runs a collection process against your AWS account to prepare and build an interactive visualization for each component along with their connections. Some have called it Google Maps for your AWS account, and to put it simply CloudMapper shows how your AWS environment actually looks.

To see the level of interaction check out their online demo of a deployed application in the us-east-1 region. Below is the CloudMapper visualization of the web applicatoin deployment highlighted in several of my Terraform posts.

cloudmapper.png

CloudMapper was built by Scott Piper in conjunction with Duo Security and luckily for us, they have open sourced their work and continue to  maintain it.  Of the three tools mentioned, it definetly provides the most robust view in terms of connectivity and security for visualinzing an AWS environment.  To get started using CloudMapper check out the product page as well as the installation and setup details on GitHub.

Benefits:

  • Especially good for seeing how resources are connected, and visualizing your AWS environment.

  • Interactive web diagram is extremely handy for understanding and validating your deployment.

  • I have found CloudMapper to be the most thorough tool of the three highlighted

  • Free / Open Source

Nice to Haves:

  • Setup is several steps and more involved compared to the other tools. I did run into a number of compatibility issues with some of the backend Python packages - which reminded me that yes, it is open source.

  • Collection phase can take some time, as it is truly pulling all the metadata information for your entire AWS account across all components and regions.

  • Would be nice to have this exported in different formats - currently supports PNG and JSON only. Visio and PDF are some of other formats similar tools support.

  • Support only for AWS, it would nice to be able to see support for other clouds (Azure, GCP, etc.)