Visualizing RVTools

One of the my most popular blog posts stems from a presentation I provided at a local VMUG over 3 years ago. During my presentation, inspired by Kendrick Coleman, I talked about everyday low cost & free tools that help in administering a VMware environment, and one of my favorites is RVTools.  In fact when paired with Microsoft Excel Pivot Tables, RVTools is extremely powerful.

Fast forward a little bit, and as visualization tools have become more accessible and easy to use, I would like to share with you another way that you can utilize RVTools to help visualize your VMware environment.  One such visualization product that I was recently introduced to is Tibco Spotfire Desktop.  Spotfire is not a free tool, although they do offer a 30-day trial which I am using for this post.  Spotfire at it's most basic level, allows you to import an Excel spreadsheet, CSV, and a variety of other data inputs and visualize them in a number of different ways.

I definitely subscribe to a 'picture is worth 1000 words' so naturally I wanted to see how I could use an export of RVTools to create meaningful Spotfire visuals.  I started small, building on my previous RVTools & Pivot Tables post where we categorized our VMs by O/S, Avg. CPU & Avg. Memory Size.  This is a quick recap of what that looked like in tabular form:

The first thing to do is to install Spotfire, which is straight forward, although support is currently limited to only Microsoft operating systems - no love for my Mac.  Once installed it is very simple to open a source file that will provide the data for the visualizations.  In my case I am opening the Excel file that was exported by RVTools and used to create my pivot tables.

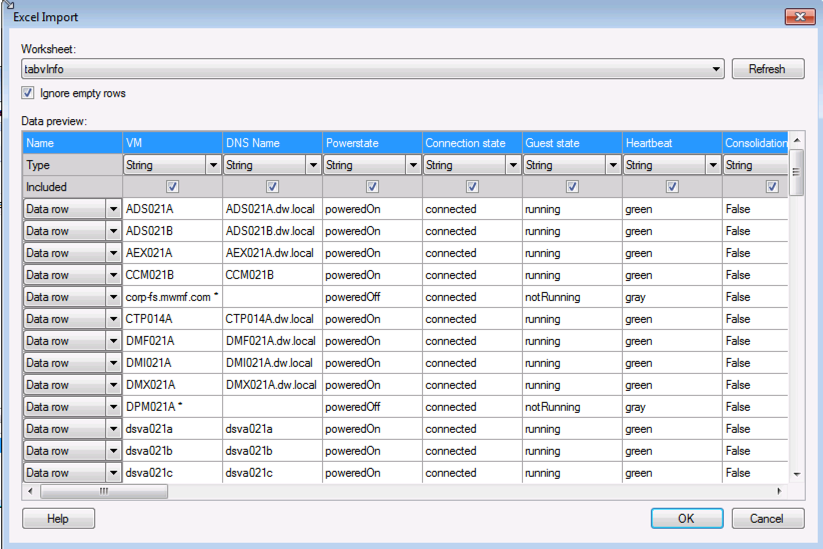
I am then prompted to select the Worksheet that we will build from and I selected the tabvinfo Worksheet as it is an excellent source of VM data.

What I really like about Tibco Spotfire is that once the data file is imported, the Recommended Visualization screen appears to help assist with different ways to visualize the data.  Scatter Plots, Graphs, Pie Charts - take your pick.  I love how you can select different data categories and rows and the recommended visuals change dynamically.

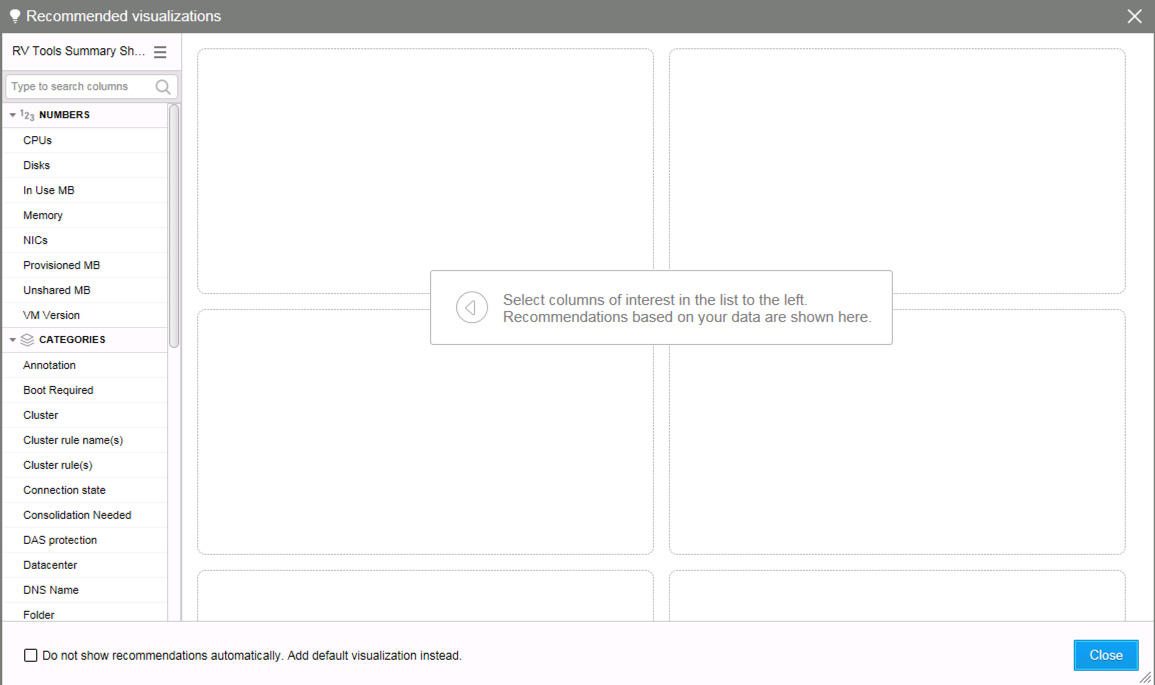
Below I picked OS as my building block, and you can see the various visuals instantly provided. These can then be added to your working dashboard/project using the Add this button.

After adding as many visuals as you wold like, it is very straight forward to duplicate, copy or edit any visual.  I changed the Tree Size view to show Avg. CPU and then duplicated it to show Avg. Memory.

I outlined my dashboard in a quadrant view to easily showcase the breakdown of VMs by OS, Avg. CPU, Avg. Memory, and power state - On/Off.  Very powerful and easy way to consume the data - which as you hover over any visual (box, pie slice or bar) will also highlight the equivalent piece of relevant data in the other quadrants.  

RVTools Visualization.png

So I can see below that Windows Server 2008 R2 64-bit accounts for 33.9% of my VMs, the majority of which are powered on, accounting for fourth largest average number of CPUs, and fifth largest average memory footprint.

I really like the simplicity of the product and plan on building some more visuals, perhaps by examining some further RVTools output.

RVTools & Excel....Shooting for Consistency

Now that we have some more pivot table experts in our midst, I will be wrapping up this series of RVTools & Excel, with a focus on consistency. As VMware admins we all maintain to strive a level of consistency within our environment, but we all know that life happens. One thing leads to another and behold - we have an environment with various inconsistencies. These inconsistencies are not always visible to us because some of them are settings that are tucked away in the depths of the vCenter client.

Consistency

No need to fear, there are plenty of ways to surface these settings and work towards maintaining a consistent environment. Let's see how RVTools and Excel can help us for the following examples:

  1. Consistent NTP Server Settings for ESXi Hosts
  2. Indentify Old Snapshots on VMs
  3. Consistent MTU Size on our ESXi Network Adapters
  4. Roll up various vCenter Health Alerts.

Before we start, if you haven't read the first two posts on using RVTools and Excel, I encourage you to start here and read up on them.

NTP

Time is a big deal for IT admins. Not only do we all need more of it, but we also need to be sure we all are keying off of the same source and time zone. This information is collected for us in the tabvHost output from RVTools - with the following column headers: NTP Server(s), Time Zone, Time Zone Name.

Utilize your pivot table skills to create a pivot table using the tabvHost as your source and then proceed to create the following pivot:

NTP Configuration

This should help you quickly indentify any hosts that don't have a consistent NTP server setting. Looks like I have some updates to make.

Snapshots

Snapshots are an awesome feature of VMware, but not if they hang around forever. There is no real need to create a Pivot on these as the RVTools tabvSnapshot tab gives a nice comprehensive list of snapshots in our environment. To keep with the theme I did use this tab to create a pivot on Snapshot name and time so that you can see how old some of these snapshots are.

Snapshots

MTU Size

Setting the MTU size correctly on your vSwitch is a big deal if you have jumbo frames in your environment and want to be sure you not fragmenting packets. Typically you will see MTU sizes of either 1500 or 9000 depending on if you are configured for jumbo frames. The tabvSwitch and tavbSC_VMK both pivot nicely to show us the MTU settings. In this example I have seperate vSwitchs and Port Groups configured with a higher MTU size for my ISCSI traffic.

MTU Settings

vCenter Health Alerts

One of the new items that RVTools surfaces in their latest release, is a tab shows active vCenter Health Messages. Let's face it we all grow immune at times to systems constantly reminding us of health issues, but this pivot is helpful to show us just how big or small our problems might be. I like to quantify it by browsing to the tabvHealth tab and peforming a pivot on the Message then sorting the items in descending order. Like this:

vHealth Messages

This helps me indentify what alarm has the most number of 'opportunities' for me to address. It is then easy to double click on any of the row totals to dive in to see the details for the systems generating the messages.

VMHealth Details

Wrap Up

There are a ton of other examples that I could have showcased in this series, but part of the fun is finding and creating your own favorite pivots. I encourage you to write about one you like (VMTools Status, Bios Version, VMs with CD ROM attached, etc.) and share with the community.

Cheers.

RVTools & Excel - Part Deux

In this post we are going to build upon the RVTools data that we worked with in my previous post and take a dive deeper into some stats for Hosts & Datastores. Building on what we did before at the VM level, this time we will be working with the vHosts and the vDataStores tabs within our Excel export of RVTools.

Specifically I am interested in the gathering the following information:

  • Hosts: Count per Cluster, # of Sockets, Cores, Speed, vCPUs/Core, Total Physical Memory, & Allocated vRAM.
  • Storage: # of Datastores broken down by type: NFS and VMFS, Capacity, Provisioned, Utilized, & Free.

Following our reciepe from last time (you can skip to step 5, if you have been following along in this series)

  1. Install RVTools
  2. Run it against your vCenter server by providing credentials (nothing scary here, it utlizes the VI SDK so all standard VMware APIs being called)
  3. Peruse the tabs that come back....vInfo, vCPU, vMemory, vHosts, vDataStores, vNetwork, and vHealth are my personal favorites.
  4. Export to Excel using File > Export all to Excel
  5. Open up the exported file in Excel and browse to the vHosts tab
  6. Select all of the Data on this tab (I usually perform a Ctrl+A, but you can also hit the Select All button located in the top left corner of the worksheet.
  7. Create a new Pivot Table...Mileage will vary depending on what version of Excel you are using for this next step...in Office 2010, it is located on the Insert > Pivot Table, on a Mac it is located in Data > Pivot Table. When prompted open the Pivot table up as a new sheet.
  8. Using the Excel Pivot Table Builder, clear out all of the default entries by dragging and dropping values out of the Row, Values, & Columns Field.
  9. Now Find and Drag the following Entries into the appropriate Pivot Table fields:
    • Values Field: Host, # CPU, # Cores, Speed, # vCPUs, vCPUs per Core
    • Row Label Field: DataCenter, Cluster, Host

You will now have something that should look similar to the sheet below, which if you update vCPU/core to an AVERAGE rather then a SUM will allow us to achieve what we were looking for.

Screen Shot 2014-03-19 at 2.44.15 PM.png

You could easily break this out by ESX version, Model, Domain, or EVC type for that matter. One of the wonders of Pivot Tables is that you can slice and dice any type of relational data quickly.

Let's complete the information for our hosts by adding the following memory items in the Values Field of our Pivot Table: # Memory, vRAM, Memory Usage % to get an idea of the memory footprint we have committed and are using.

This results in a nice summary statement regarding our Hosts:

  • CPU: 14 hosts, 28 Sockets, 148 Cores, 45 GHz, 607 vCPUs, 4.2 vCPU/Core (Avg.)
  • Memory: 2.5 TB Physical Memory, 1.18 TB vRAM, 40% Avg. Mem Utilization

Now let's turn our attention to Storage by repeating steps 6-10 using the vDataStore tab. We will be using the following entries in our Storage Pivot:

  • Values Field: Name, Capacity MB, Provisioned MB, In Use MB, Free MB
  • Row Label Field: Type, Name

This allows you to quickly share information about our Storage:

  • NFS: 13 DataStores, 106 TB Capacity, 20.5 TB Provisioned, 20.5 Utilized, 85.6 TB Free
  • VMFS: 126 DataStores, 146.5 TB Capacity, 104.5 TB Provisioned, 58 TB Utilized, 88.7 TB Free

Other areas that may be of interest relating to storage that are interesting to map out on this Pivot are: Block size, VMFS Major Version, # of VMs/Datastore

If you have found these last two posts helpful please share your favorite Pivots using RVTools data. In the next post we can spend some time looking at how to catch anomolies within a VMware environment as we strive to maintain consistency.


RVTools & Excel - A Great Way to Pull VMware Stats

Growing up as a kid and now as an adult who loves sports, I have always been a bit obsessed with statistics. Stats, Stats, Stats. I find statistics to be a helpful way to baseline, compare, and motivate.

So it is no suprise that when I was introduced, courtesy of Duncan Epping, to a free product that would allow me to collect and grab stats on my VMware environment, I had to learn more.

Screen Shot 2014-03-07 at 8.56.01 AM.png

The tool is called RVTools and is a .NET Application that collects lots of great information about your VMs, Hosts, CPU, Memory, Datastores, Network Switches, Snapshots....the list goes on and on. It displays the output in a tabular view and is super easy to export. I have found that coupled with the magic of Excel pivot tables (a must for anyone obessed with stats like me), you can quickly create and share some great insights about your VMware landscape.

Let me show you some of the insights I have gathered on a sample VMware environment:

  • Overview: ESXi v. 5.0 / 14 Hosts / 372 VMs / 5 Clusters / 139 DataStores / DataCenters
  • VM O/S: 22 Flavors, 34% W2K8R2, 27% VDI, 16% W2K3 Standard (x32)
  • VM Info: 372 Total (241 Powered On), 2 vCPU, 5GB vRAM, 2 vDisks
  • CPU: 28 Sockets, 148 Cores, 45 GHz, 607 vCPUs, 4.2 vCPU/Core (Avg.)
  • Memory: 2.5 TB Physical, 1.8 TB Allocated, 40% Avg. Utilization
  • Storage - NFS: 13 DataStores, 106 TB Capacity, 20.5 TB Provisioned, 20.5 Utilized
  • Storage - VMFS: 126 DataStores, 146.5 TB Capacity, 104.5 TB Provisioned, 58 TB Utilized
  • Snapshots: 10 Active

This is a great summary of information that can easily be shared among your team, managment, or fellow VMware friends. I like to think of it as the 'State of the Union' for my VMware environment. Of course, no envioronment is created equal, so mileage may very on what your data looks like - but the important thing is that this information shows that you are 'in command' of the environment that you support.

How I got here.

  1. Install RVTools
  2. Run it against your vCenter server by providing credentials(nothing scary here, it utlizes the VI SDK so all standard VMware APIs being called)
  3. Peruse the tabs that come back....vInfo, vCPU, vMemory, vHosts, vDataStores, vNetwork, and vHealth are my personal favorites.
  4. Export to Excel using File > Export all to Excel
  5. Open up the exported file in Excel and browse to the vInfo tab
  6. Select all of the Data on this tab (I usually perform a Ctrl+A, but you can also hit the Select All button located in the top left corner of the worksheet.
  7. Create a Pivot Table...Mileage will vary depending on what version of Excel you are using for this next step...in Office 2007, it is located on the Insert > Pivot Table, on a Mac it is located in Data > Pivot Table. When prompted open the Pivot table up as a new sheet.
  8. Stop & Breathe.....Pivot Tables are extremely powerful but can be a bit overwhelming if you are not use to using them. We will go through one Pivot here and build on them in future posts if there is interest.
  9. For this post, we will find the number of VMs, Average # of vCPUs and vRAM per VM, % of running O/S, and in use Memory.
  10. Using the Excel Pivot Table Builder, clear out all of the default entries by dragging and dropping values out of the Row, Values, & Columns Field.
Screen Shot 2014-03-06 at 10.42.47 AM.png

Now Find and Drag the following Entries into the appropriate Pivot Table fields:

        1. Values Field: **VM, Memory, CPUs,**
        2. Row Labels Field: **Datacenter, OS**

You will now have something that should look similar to this.

Screen Shot 2014-03-06 at 11.13.14 AM.png

Let's not stop there....counts are great and everything but let's look at some averages and %'s. To do that drag another 'instance' of VM and In Use MB into the Values Field so that the Values Field looks like this:

Screen Shot 2014-03-06 at 12.08.00 PM.png

Let's Modify Count of VM2 to a % by clicking on it in the Values Field, Hitting Options, and selecting % of column. I like to also change the Field Name to % of Total VMs

Screen Shot 2014-03-06 at 12.11.45 PM.png

Perform a simliar step for CPUs, changing from a SUM of CPUs to an Average of CPUs and Sum of Memory to Average of Memory. I aslo added the Powerstate field to the Report Filter so that I can easily filter between powered off, powered on, or all VMs.

Screen Shot 2014-03-07 at 8.41.21 AM.png
Screen Shot 2014-03-07 at 8.40.27 AM.png

Looking at the final results we can see that we have a 372 VMs, which average around 2 vCPUs and 5GB vRAM. A third of these are W2K8 R2, 25% are Win7 (VDI), and then the rest is a flavor of other stuff including many distros of Linux (virtual appliances mostly). You can also peform a quick filter on powered on VMs and see that of the 372 VMs only 241 are powered on.

This is insightful and once you get comforatable with Pivot Tables then you can get highly creative. Play around with adding, sorting, moving things around.

In another post I will share some insights I gathered about Hosts & Datastores. For now, the inner stats geek has been satisfied.